Last updated: June 24, 2026
Protein Concentration Calculator

Creators
Dharmendra SinghReviewers
Creators
Dharmendra SinghReviewers
Quick Answer
Protein concentration is calculated from a colorimetric assay standard curve as C = ((Absorbance − y-intercept) ÷ slope) × dilution factor. For example, an A₅₉₅ of 0.45 with a Bradford curve slope of 0.4 and intercept 0.05 gives 1.0 mg/mL. This free calculator supports Bradford, BCA, and Lowry assays and also reports µg/mL and total protein from the sample volume.
To find protein concentration, subtract the standard curve's y-intercept from the absorbance, divide by the slope, then multiply by the dilution factor.
Key Takeaways
- Protein concentration = ((Absorbance − y-intercept) ÷ slope) × dilution factor, from your standard curve.
- Build the curve with a reference protein (usually BSA) and aim for R² ≥ 0.99.
- Keep sample absorbance in the 0.1–1.0 AU linear range; dilute if higher.
- Multiply by the dilution factor to recover the true, undiluted concentration.
- 1 mg/mL = 1,000 µg/mL; total protein = concentration × sample volume.
Creators
Dharmendra SinghReviewers
Creators
Dharmendra SinghReviewers
Formula
C = ((A − b) ÷ m) × Dilution Factor
Where:
- C=Protein concentration(mg/mL)
- A=Sample absorbance (e.g. A₅₉₅ for Bradford)(AU)
- m=Standard-curve slope(AU per mg/mL)
- b=Standard-curve y-intercept(AU)
- DF=Dilution factor(×)
Worked Examples
Bradford assay — undiluted sample
A sample reads A₅₉₅ = 0.45 against a BSA standard curve with slope 0.4 and y-intercept 0.05.
- 1Subtract the y-intercept: 0.45 − 0.05 = 0.40
- 2Divide by the slope: 0.40 ÷ 0.4 = 1.0
- 3Apply dilution factor (×1): 1.0 mg/mL
- 4Equivalent to 1000 µg/mL
Diluted lysate with total protein
A cell lysate is diluted 10× and reads A₅₉₅ = 0.30 (slope 0.4, intercept 0.02); sample volume is 0.5 mL.
- 1Back-calculate diluted conc: (0.30 − 0.02) ÷ 0.4 = 0.70 mg/mL
- 2Multiply by dilution factor: 0.70 × 10 = 7.0 mg/mL
- 3Total protein = 7.0 mg/mL × 0.5 mL = 3.5 mg
- 4Reading 0.30 AU is inside the reliable 0.1–1.0 range
Introduction
The Protein Concentration Calculator converts an absorbance reading from a colorimetric assay into a protein concentration using your standard curve. Enter the sample absorbance, the curve's slope and y-intercept, and any dilution factor, and it solves C = ((A − b) ÷ m) × DF — the back-calculation behind the Bradford, BCA, and Lowry assays. It reports the result in mg/mL and µg/mL, plus the total protein in your sample. This is an essential step before SDS-PAGE, Western blotting, or enzyme assays. For nucleic acids, see our DNA concentration calculator; for molecular weight, the protein molecular weight calculator.
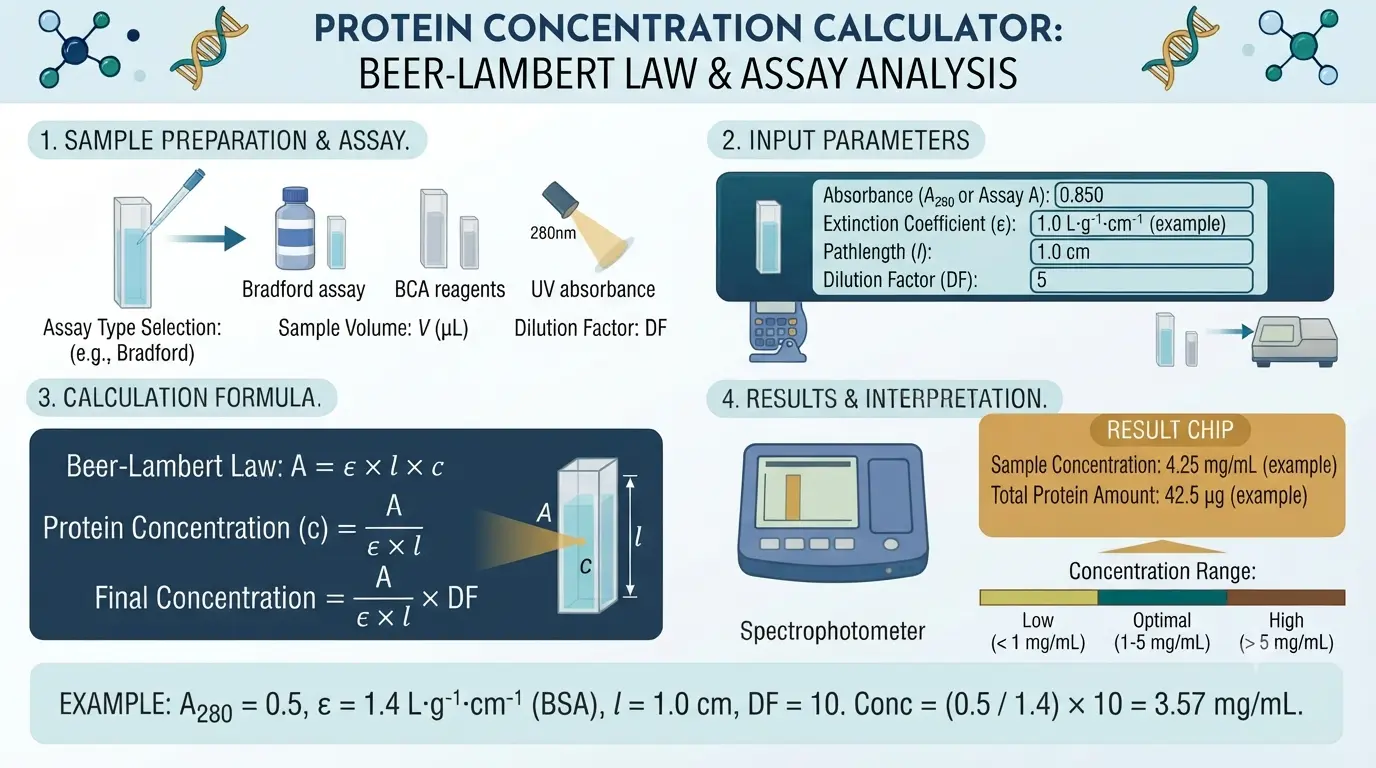
How the Protein Concentration Calculator Works
Colorimetric assays produce a color whose intensity (absorbance) is proportional to protein amount. You first build a standard curve by measuring known concentrations of a reference protein (usually BSA), then fit a straight line to get a slope (m) and y-intercept (b). To find an unknown, you rearrange the line equation A = mC + b to solve for concentration, then multiply by the dilution factor to recover the original (undiluted) concentration.
Build a standard curve from known BSA concentrations
Fit a line to get slope (m) and y-intercept (b)
Read your sample's blank-corrected absorbance
Solve C = (A − b) ÷ m for the diluted concentration
Multiply by the dilution factor for the true concentration
Always subtract the blank (buffer-only) absorbance from every reading before entering it here — the y-intercept already accounts for the reagent background.
Bradford, BCA, and Lowry Assays Compared
Several colorimetric methods measure protein, each with different chemistry, wavelength, and compatibility. The calculator works with any of them — you just supply the standard curve from that assay. The table below summarizes the most common choices used in protein research labs.
| Assay | Wavelength | Range | Notes |
|---|---|---|---|
| Bradford | 595 nm | 1–20 µg (1–1500 µg/mL) | Fast, but detergent-sensitive |
| BCA | 562 nm | 0.5–1500 µg/mL | Detergent-compatible, slower |
| Lowry | 750 nm | 1–1500 µg/mL | Sensitive, many interferences |
| UV A280 | 280 nm | 0.1–100 mg/mL | No reagent; needs pure protein |
Use the same assay for both the standard curve and the unknown — slopes are not interchangeable between methods.
Building a Reliable Standard Curve
The accuracy of your result depends almost entirely on the standard curve. Prepare a dilution series of a reference protein (BSA is standard) spanning the assay's linear range, measure each in duplicate or triplicate, and fit a linear regression. A good curve has an R² ≥ 0.99. Use the slope and intercept from that fit directly in this calculator.
Use at least 5–7 standard concentrations across the linear range
Run standards in duplicate or triplicate and average
Include a blank (zero protein) to set the baseline
Fit a linear regression and check R² ≥ 0.99
Discard points where absorbance saturates (above ~1.0 AU)
If your samples differ chemically from BSA (e.g. membrane proteins), a matched standard or a different reference protein improves accuracy.
Staying in the Linear Range
Beer–Lambert's law only holds while absorbance is roughly 0.1–1.0 AU. Readings above ~1.0 fall off the linear portion of the curve and under-report concentration; readings below 0.1 are dominated by noise. If your sample is too concentrated, dilute it and enter the dilution factor — the calculator multiplies it back automatically.
Target sample absorbance between 0.1 and 1.0 AU
Too high (>1.0): dilute 2–10× and re-read
Too low (<0.1): use less diluent or a more sensitive assay
Record the exact dilution so the factor is correct
Re-blank if you change buffer or reagent lot
Worked Example: Diluted Cell Lysate
A cell lysate is diluted 10× and reads A₅₉₅ = 0.30. The BSA standard curve has a slope of 0.4 and a y-intercept of 0.02. First back-calculate the diluted concentration: (0.30 − 0.02) ÷ 0.4 = 0.70 mg/mL. Multiply by the dilution factor: 0.70 × 10 = 7.0 mg/mL. If the original sample volume was 0.5 mL, the total protein is 7.0 × 0.5 = 3.5 mg — exactly what the calculator returns.
Because 0.30 AU sits inside the 0.1–1.0 linear range, this reading is reliable without further dilution.
Why Protein Quantification Matters
Knowing protein concentration is a prerequisite for nearly every quantitative protein method. Loading equal protein amounts makes experiments comparable and reproducible — a core expectation of journals and regulators.
- SDS-PAGE & Western blot:
load equal total protein per lane
- Enzyme assays:
report activity per mg of protein (specific activity)
- ELISA & immunoassays:
normalize sample input
- Protein purification:
track yield and purity across steps
- Drug formulation & QC:
verify dose and batch consistency
Common Protein Assay Mistakes
Most quantification errors come from the standard curve or sample handling rather than the math. Watching for these keeps your numbers trustworthy.
Not subtracting the blank before reading samples
Reading outside the 0.1–1.0 AU linear range
Using a Bradford slope with a BCA reading (or vice versa)
Forgetting the dilution factor when samples were diluted
Detergents or reducing agents interfering with Bradford
A standard curve with R² well below 0.99
Protein Concentration Glossary
Key terms used in colorimetric protein quantification. Understanding them helps you read assay kits and interpret results.
| Term | Definition |
|---|---|
| Absorbance (A) | The light a sample absorbs at a set wavelength; proportional to color intensity. |
| Standard curve | A plot of absorbance vs known concentration used to quantify unknowns. |
| Slope (m) | Change in absorbance per unit concentration from the curve fit. |
| Y-intercept (b) | Absorbance at zero protein (reagent background). |
| Dilution factor | How many times a sample was diluted before measurement. |
| BSA | Bovine serum albumin, the most common reference protein. |
| Linear range | The concentration band where absorbance is proportional to protein. |
| R² | Goodness-of-fit of the standard curve; aim for ≥ 0.99. |
Quick Reference Card
Protein Concentration — Quick Reference
Quick reference • Protein Concentration Calculator
C = ((Absorbance − y-intercept) ÷ slope) × dilution factorValid range: Absorbance 0.1–1.0 AU (linear range); R² ≥ 0.99 standard curve
Common Values
⚠ Watch Out
- •Blank-correct every reading before entering it
- •Keep absorbance within 0.1–1.0 AU
- •Use the same assay for standards and unknowns
- •Don't forget the dilution factor for diluted samples
Pro Tips
- →Run standards and samples in duplicate or triplicate
- →Check the standard curve R² is at least 0.99
- →Dilute over-range samples and re-read instead of extrapolating
- →Match the reference protein to your sample type when possible
FAQs
How do you calculate protein concentration from absorbance?
Use your standard curve's line equation A = mC + b and solve for concentration: C = (A − b) ÷ m, then multiply by any dilution factor. For example, an absorbance of 0.45 with slope 0.4 and intercept 0.05 gives (0.45 − 0.05) ÷ 0.4 = 1.0 mg/mL.
What is the Bradford assay formula?
The Bradford assay measures absorbance at 595 nm and relates it to protein via a BSA standard curve. The concentration is C = (A₅₉₅ − b) ÷ m, where m and b come from the linear fit of your standards. Multiply by the dilution factor for the original concentration.
What is a standard curve and why do I need one?
A standard curve plots absorbance against known protein concentrations, giving a slope and intercept that convert any unknown's absorbance into concentration. Without it, an absorbance reading alone can't be turned into a concentration, since the relationship differs by assay and instrument.
What is the dilution factor?
The dilution factor is how many times you diluted a sample before measuring — for a 1-in-10 dilution it's 10. Because the assay reports the diluted concentration, you multiply by the dilution factor to recover the true, undiluted concentration.
Why should absorbance stay between 0.1 and 1.0?
Beer–Lambert's law (absorbance proportional to concentration) only holds in that linear range. Above ~1.0 AU the signal saturates and under-reports protein; below 0.1 AU noise dominates. If your reading is too high, dilute the sample and enter the dilution factor.
Which protein assay should I use?
Bradford is fast and cheap but sensitive to detergents; BCA tolerates detergents and is great for membrane proteins but is slower; Lowry is sensitive but has many interferences. UV A280 needs no reagent but requires pure protein. Use the same assay for standards and unknowns.
How do I convert mg/mL to µg/mL?
Multiply mg/mL by 1,000 to get µg/mL, since 1 mg = 1,000 µg. The calculator shows both units automatically, so 1.0 mg/mL also displays as 1,000 µg/mL.
How do I calculate total protein in my sample?
Multiply the concentration by the sample volume. Enter the volume in milliliters and the calculator returns total protein in milligrams — for example, 7.0 mg/mL × 0.5 mL = 3.5 mg of total protein.
Why is my calculated concentration negative or zero?
A negative value means your sample's absorbance was below the curve's y-intercept (essentially below the blank), which is non-physical, so the calculator reports zero. Check that you blank-corrected the reading and that the sample actually contains protein.
Can I use this calculator for A280 (UV) quantification?
Yes, if you have a standard curve in absorbance-vs-concentration form. For pure proteins with a known extinction coefficient, A280-based concentration is better handled with the Beer–Lambert equation and the protein's molar absorptivity.
Is the Protein Concentration Calculator free to use?
Yes, the calculator is completely free with no registration required. You can use it unlimited times for Bradford, BCA, Lowry, or any standard-curve assay and share the results with your lab.