Last updated: June 20, 2026
Log Reduction Calculator

Creators
Dharmendra SinghReviewers
Creators
Dharmendra SinghReviewers
Quick Answer
The Log Reduction Calculator converts pre- and post-treatment microbial counts into the standard disinfection metric LR = log₁₀(N₀ / N), plus percent reduction, fold reduction, surviving fraction, and a regulatory tier label (1-log routine cleaning through 6-log sterilization-grade). Used in food safety, water treatment, hospital disinfection, and pharmaceutical sterilization to validate efficacy against EPA, FDA, EN 1276, and USP <1072> thresholds.
To calculate log reduction, divide the initial microbial count by the surviving count and take the base-10 logarithm. For example, going from one million to one thousand CFU is a 3-log reduction, equivalent to a 99.9 percent kill.
Key Takeaways
- Log reduction (LR) = log₁₀(N₀ / N) — each whole log is a 10× drop in surviving microbes
- 1-log = 90 %, 3-log = 99.9 % (NSF sanitizer), 5-log = 99.999 % (FDA juice HACCP), 6-log = 99.9999 % (sterilization-grade)
- Units cancel out: works for CFU, CFU/mL, CFU/cm², PFU — as long as N₀ and N share the same units
- 'No recovery' is reported as ≥ log₁₀(N₀ / detection limit), never as infinite — this calculator displays it as ≥ 6-log
- Always report log reduction with contact time, temperature, organism, and soil load — the number alone is not meaningful
Creators
Dharmendra SinghReviewers
Creators
Dharmendra SinghReviewers
Formula
LR = log₁₀(N₀ / N)
Where:
- LR=Log reduction value (decimal logs killed)
- N_0=Initial microbial population before treatment(CFU or CFU/mL)
- N=Surviving microbial population after treatment(CFU or CFU/mL)
Worked Examples
3-Log Sanitizer (NSF / EPA food-contact minimum)
A food-contact sanitizer reduces a starting Salmonella load of 1,000,000 CFU/mL down to 1,000 CFU/mL after a 30-second contact at 20 °C.
- 1Identify N₀ = 1,000,000 CFU/mL and N = 1,000 CFU/mL
- 2Compute ratio: N₀ / N = 1,000,000 / 1,000 = 1,000
- 3Apply log₁₀: LR = log₁₀(1,000) = 3
- 4Convert to percent: 1 − 1/1,000 = 99.9 %
- 5Classify: meets NSF/EPA 3-log food-contact sanitizer standard
5-Log Produce Wash (FDA Juice HACCP)
A peracetic-acid produce wash takes E. coli O157:H7 from 100,000,000 CFU/mL to 1,000 CFU/mL on inoculated lettuce — meeting the FDA 5-log requirement for fresh-squeezed juice.
- 1Ratio: N₀ / N = 100,000,000 / 1,000 = 100,000
- 2LR = log₁₀(100,000) = 5
- 3Percent reduction = 99.999 %
- 4Meets FDA Juice HACCP 5-log pathogen-reduction rule (21 CFR 120.24)
6-Log Sterilization (USP <1072>)
Autoclave validation reduces Geobacillus stearothermophilus spores from 1,000,000 CFU/carrier to undetectable (complete kill) after 121 °C / 15 min steam exposure.
- 1N₀ = 10⁶ CFU; N = 0 (no recoverable organisms)
- 2Complete kill is treated as ≥ 6-log (the population was driven below the detection limit)
- 3Percent reduction reported as 100 %
- 4Meets USP <1072> sterilization-grade threshold (≥ 6-log Sterility Assurance Level)
Introduction
The Log Reduction Calculator converts before-and-after microbial counts (N₀ and N) into the standard food-safety, water-treatment, and disinfection metric: log reduction (LR) = log₁₀(N₀ / N). Each whole log represents a 10-fold (90 %) drop in surviving organisms, so a 3-log reduction kills 99.9 % of a population, a 5-log kills 99.999 %, and a 6-log kills 99.9999 % — the sterilization-grade threshold used by USP <1072> on disinfectants and antiseptics and FDA pasteurization rules. Whether you are validating a hospital disinfectant, a produce wash, an autoclave cycle, or a water-treatment train, this tool gives an instant, defensible kill metric. Pair it with our generation time calculator for bacterial growth kinetics, or the cell dilution calculator when preparing standard inocula.
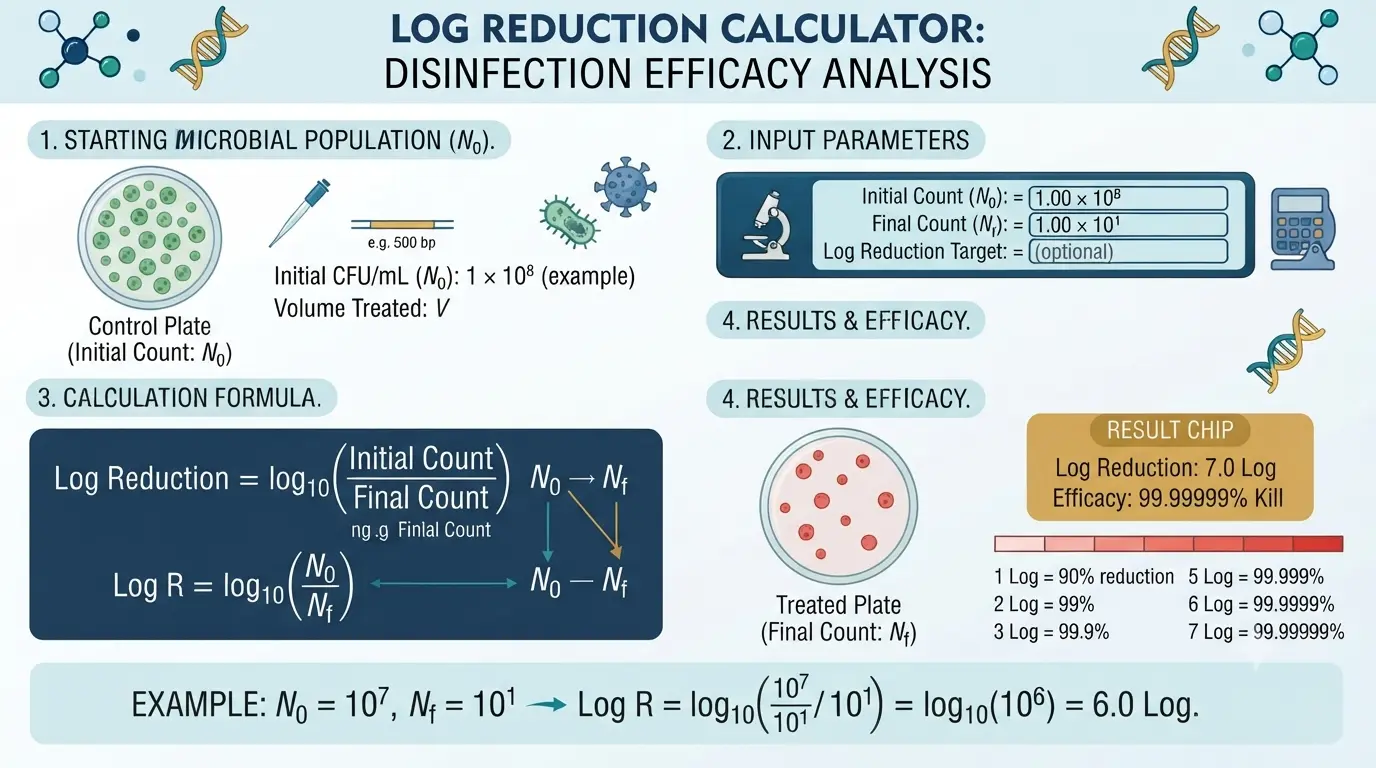
What Is Log Reduction?
Log reduction measures how effectively a process kills or removes microorganisms, expressed as the base-10 logarithm of the ratio between the starting population (N₀) and the surviving population (N). Because microbial populations span enormous ranges — a single millilitre of culture can hold anywhere from 10 to 10¹⁰ organisms — kill is reported on a logarithmic scale rather than a linear one. A 1-log reduction means a 10-fold drop (90 % killed); each additional log multiplies the kill by another factor of 10. This logarithmic framing matches the underlying biology: under fixed conditions, most disinfection and thermal processes inactivate a *constant fraction* of the surviving population per unit time, so kill accumulates in even log steps rather than even percentage steps.
1-log = 90 % killed (10× fewer survivors)
2-log = 99 % killed (100× fewer)
3-log = 99.9 % killed (1,000× fewer)
6-log = 99.9999 % killed (1,000,000× fewer) — the sterilization benchmark
Each whole log is one order of magnitude — never confuse a '6-log' with '6× better than 1-log' (it is actually 100,000× better)
How to Use This Calculator
The calculation is unit-agnostic: as long as N₀ and N share units (CFU, CFU/mL, CFU/cm², plaque-forming units, etc.), the ratio cancels out and the log reduction is identical. Enter your two plate counts and the calculator returns the log reduction plus four supporting metrics and a regulatory tier label.
Enter the initial microbial count (N₀) from your pre-treatment sample plating
Enter the surviving count (N) from the post-treatment sample plating using the same units
Read the primary result — log reduction — along with percent reduction, fold reduction, surviving fraction, and the matched regulatory tier
Enter 0 for N to indicate complete kill (no detectable colonies) — reported as ≥ 6-log to reflect the assay detection limit
Always report log reduction alongside contact time, temperature, and organic-soil load used in the test
Log Reduction vs Percent Reduction — Conversion Table
Log reduction and percent reduction describe the same kill on two different scales. Percent reduction is the linear fraction destroyed, (1 − N/N₀) × 100; log reduction is log₁₀(N₀/N). The log scale is preferred in regulated industries because it cleanly separates kills that look almost identical as percentages — 99.9 % and 99.9999 % differ by only 0.0999 % linearly, yet represent a 1,000-fold difference in survivors. Use this table as a quick mental conversion.
| Log Reduction | Percent Reduction | Fold Reduction | Surviving Fraction | Survivors from 10⁶ start |
|---|---|---|---|---|
| 1-log | 90 % | 10× | 10 % | 100,000 CFU |
| 2-log | 99 % | 100× | 1 % | 10,000 CFU |
| 3-log | 99.9 % | 1,000× | 0.1 % | 1,000 CFU |
| 4-log | 99.99 % | 10,000× | 0.01 % | 100 CFU |
| 5-log | 99.999 % | 100,000× | 0.001 % | 10 CFU |
| 6-log | 99.9999 % | 1,000,000× | 0.0001 % | 1 CFU |
| 7-log | 99.99999 % | 10,000,000× | 0.00001 % | 0.1 CFU (≤ 1) |
Regulatory Efficacy Tiers
Different regulators set different log-reduction thresholds for the same word ('sanitizer', 'disinfectant', 'sterilant'). Knowing which standard applies to your product or process is critical for labelling and validation — using the wrong term on a label is a regulatory violation in most jurisdictions.
| Log Reduction | Percent Kill | Category | Example Standard |
|---|---|---|---|
| 1-log | 90 % | Routine cleaning | General hygiene baseline |
| 2-log | 99 % | Hygienic cleaning | EN 13697 (low-soil) |
| 3-log | 99.9 % | Sanitizer (food-contact) | NSF P152 / EPA DIS/TSS-10 |
| 4-log | 99.99 % | Hospital disinfectant (bacteria) | EN 1276 suspension test |
| 5-log | 99.999 % | Produce wash / Juice HACCP | FDA 21 CFR 120.24 |
| 6-log | 99.9999 % | Sterilization / pasteurization | USP <1072>; FDA 12-D milk |
Kill Kinetics: D-value, z-value, and Chick's Law
Most disinfection and thermal-inactivation processes follow first-order (logarithmic) kinetics, first described by Harriette Chick in 1908. Under fixed conditions, a constant fraction of the surviving population dies per unit time — which is exactly why kill accumulates in even log steps. Three derived parameters connect contact time to log reduction and let you predict the kill a process will deliver before you run it.
- **D-value (decimal reduction time):
** the exposure time needed for a 1-log (90 %) reduction at a fixed temperature/concentration. Total log reduction = exposure time ÷ D-value.
- **z-value:
** the temperature rise (°C) required to reduce the D-value 10-fold — it describes how quickly heat kill accelerates with temperature.
- **Chick-Watson law:
** for chemical disinfectants, log reduction ∝ C^n × t, where C is concentration, t is contact time, and n is the dilution coefficient — doubling contact time often adds roughly one more log of kill.
- **F₀ value:
** the equivalent sterilization time at 121 °C, used to design autoclave cycles to a target log reduction.
- **12-D concept:
** the FDA milk and low-acid-canned-food standard delivers a 12-log inactivation of the reference pathogen — twelve D-values of exposure.
Because kill is logarithmic, the *time* to go from 10⁶ to 10⁵ (one D-value) is the same as the time to go from 10² to 10¹. The last log is just as hard-won as the first — there is no point at which the remaining organisms 'give up' faster.
Microbial Resistance Hierarchy
The same process delivers very different log reductions against different organisms. The classic Spaulding resistance hierarchy ranks microbial classes from easiest to hardest to kill. A disinfectant validated for a 6-log kill of vegetative bacteria may achieve only 1–2 logs against bacterial spores — which is why sporicidal and sterilization claims demand far longer contact times.
| Resistance | Microbial Class | Example Organisms | Relative Difficulty |
|---|---|---|---|
| Lowest | Enveloped viruses | Influenza, SARS-CoV-2, HIV | Easiest to inactivate |
| Low | Vegetative bacteria | E. coli, Salmonella, Staphylococcus | Standard sanitizer target |
| Moderate | Fungi | Candida, Aspergillus | Moderate contact time |
| High | Non-enveloped viruses | Norovirus, Poliovirus, Rotavirus | Resistant to many disinfectants |
| Higher | Mycobacteria | M. tuberculosis, M. bovis | Requires tuberculocidal claim |
| Highest | Bacterial spores | Clostridioides difficile, Bacillus, Geobacillus | Sporicidal / sterilization only |
| Extreme | Prions | CJD, scrapie agents | Resist standard sterilization |
Where Log Reduction Is Used
Log reduction is the lingua franca of microbial-control work across very different industries — anywhere a process must verifiably remove or inactivate organisms.
Hospital and surgical-instrument disinfectant validation (EN 1276, EN 13727, AOAC 961.02)
Drinking-water and wastewater treatment — chlorine, UV, and ozone CT-value efficacy
Food and beverage processing — pasteurization, fresh-produce washing, surface sanitation
Pharmaceutical sterilization (autoclave, gamma, ethylene oxide) per USP <1072> and ISO 11137
Cosmetics preservative-efficacy testing (USP <51> / EP 5.1.3)
Hand-hygiene product claims (EN 1500 hygienic handrub; EN 12791 surgical scrub)
Air-handling HEPA filtration and UV-C upper-room UVGI validation
Factors That Affect Log Reduction
The same disinfectant can produce wildly different log-reduction values depending on the test conditions — which is why standards specify all of these variables precisely.
- Contact time:
most chemical disinfectants follow first-order kinetics — doubling contact time often adds ~1 log of kill (Chick-Watson law)
- Temperature:
each 10 °C rise typically doubles biocide rate (Q₁₀ ≈ 2) for chemicals; thermal kill (heat) scales with z-value
- Organic soil load:
blood, food residue, and biofilm dramatically reduce kill — 'clean' vs 'dirty' conditions can differ by 2+ logs
- Organism resistance hierarchy:
prions > bacterial spores > mycobacteria > non-enveloped viruses > fungi > vegetative bacteria > enveloped viruses
- Inoculum size:
a 10⁸ challenge may show 5-log kill where 10⁶ would show complete kill — always report the starting load
- Detection limit (DL):
a result of 'no recovery' is only as low as your assay can detect; report it as ≥ log₁₀(N₀ / DL)
When citing a log-reduction result in a report or registration submission, always include the test method, organism, contact time, temperature, and soil condition — the number alone is meaningless without context.
How to Measure Log Reduction in the Lab
A defensible log-reduction value comes from a controlled challenge test: a known inoculum is exposed to the treatment, neutralized at a precise contact time, and the survivors are enumerated by plate count. The general workflow below underlies AOAC, ASTM E2315, and EN suspension-test methods.
Prepare and titer a standardized inoculum (typically 10⁶–10⁸ CFU/mL) and confirm N₀ by plate count
Expose the inoculum to the test treatment for the defined contact time at the defined temperature
Quench instantly with a validated neutralizer to stop kill at exactly the intended time point
Serially dilute (10-fold steps) and plate in duplicate or triplicate to bracket the expected survivor count
Incubate, count colonies, back-calculate N (CFU/mL), and compute LR = log₁₀(N₀ / N)
Run parallel controls: neutralizer toxicity, neutralizer efficacy, and an untreated viability control
Troubleshooting Log-Reduction Tests
When a log-reduction result looks wrong, the problem is usually in the test setup rather than the disinfectant. Match the symptom to the likely cause and fix before re-testing.
- Lower-than-expected kill:
neutralizer carry-over inhibiting growth is masked? Check organic-soil load, verify concentration/contact time, confirm the inoculum was fully suspended (no clumping)
- Negative log reduction (population grew):
neutralizer failed to stop residual nutrients, growth-supporting matrix, or N₀ was under-counted — re-titer the inoculum
- Inconsistent replicates:
plating technique, uneven mixing, or a thermocycler/water-bath temperature gradient — use master suspensions and calibrated equipment
- 'No recovery' but unsure of true kill:
report ≥ log₁₀(N₀ / detection limit); lower the detection limit with membrane filtration if you need to prove a higher log
- Counts off-scale (too many to count):
plate higher dilutions; a plate with > 300 colonies is unreliable
- Neutralizer is itself toxic:
switch neutralizer system (e.g., Dey-Engley vs lecithin/polysorbate) and re-run the neutralizer-toxicity control
Common Mistakes to Avoid
These errors are the usual reasons a log-reduction claim falls apart under audit or peer review. Avoiding them keeps your numbers reproducible and defensible.
Treating 'no growth' as infinite reduction — it only proves kill exceeded the detection limit; report it as ≥ log₁₀(N₀ / DL)
Reporting log reduction without the contact time, temperature, organism, and soil condition — the number alone is meaningless
Mismatched units between N₀ and N (e.g., CFU/mL vs CFU/plate) — the ratio is only valid when both share units
Confusing log reduction with percent reduction in a claim — 99.9 % is 3-log, not '3 %'
Using too low a starting inoculum, so a strong process shows complete kill and hides its true log capability — start at 10⁶ or higher
Skipping neutralizer controls, so residual disinfectant keeps killing on the plate and inflates the apparent log reduction
Applying a suspension-test log reduction to a real soiled surface — surface and dirty-condition kills are typically 1–3 logs lower
Tips for Accurate Log-Reduction Testing
Reliable log-reduction values depend as much on lab technique as on the disinfectant itself. These practices keep your numbers reproducible and defensible.
Plate samples in duplicate or triplicate at multiple 10-fold dilutions to bracket the expected count
Use an effective neutralizer (e.g., Dey-Engley broth, lecithin/polysorbate) to stop kill at the exact contact time
Run a neutralizer-toxicity and neutralizer-efficacy control alongside each test
Verify the starting inoculum titer by plate count — assumed titers introduce log-level error
Use the same enumeration medium and incubation conditions before and after treatment
For 'no growth' results, report as ≥ log₁₀(N₀ / detection limit), never as 'infinite'
Always plate the surviving sample at multiple dilutions — if the highest dilution still shows growth, your true log reduction is lower than the lowest detectable count suggests.
Log Reduction & Microbial-Control Glossary
Key terms used in log-reduction testing and disinfection science. Understanding these definitions helps you interpret results and read regulatory standards correctly.
| Term | Definition |
|---|---|
| Log Reduction (LR) | The base-10 logarithm of the ratio of initial to surviving microbial counts: log₁₀(N₀/N). Each whole log is a 10-fold kill. |
| CFU (Colony-Forming Unit) | A measure of viable microbial cells able to form a colony on agar — the standard unit for N₀ and N. |
| D-value (Decimal Reduction Time) | The time required to achieve a 1-log (90 %) reduction under fixed conditions. |
| z-value | The temperature increase (°C) needed to reduce the D-value 10-fold; describes heat-kill temperature dependence. |
| Chick-Watson Law | First-order model of chemical disinfection: log kill is proportional to concentration and contact time. |
| Sterility Assurance Level (SAL) | The probability of a single viable organism surviving sterilization; the standard target is 10⁻⁶. |
| Sanitizer | Agent achieving ≥ 3-log (99.9 %) reduction of bacteria, typically on food-contact surfaces. |
| Disinfectant | Agent achieving a higher, broader-spectrum kill (≥ 4–6 log) per EN 1276 / EPA registration. |
| Sterilant | Process or agent achieving ≥ 6-log reduction of bacterial spores (complete sterility). |
| Neutralizer | A reagent (e.g., Dey-Engley broth) that instantly stops disinfectant action at the chosen contact time. |
| Detection Limit (DL) | The lowest microbial count an assay can reliably detect; bounds the maximum reportable log reduction. |
| Bioburden | The initial population of viable microorganisms on or in a product before treatment (N₀). |
| Inoculum / Challenge | The known microbial population deliberately added to test a process's kill capability. |
| Suspension Test | A standardized assay (EN 1276, ASTM E2315) measuring kill of organisms suspended in liquid. |
Quick Reference Card
Log Reduction — Quick Reference Chart
Quick reference • Log Reduction Calculator
LR = log₁₀(N₀ / N) · % reduction = (1 − N/N₀) × 100Valid range: N₀ > 0; N ≥ 0; same units for both
Common Values
⚠ Watch Out
- •'No recovery' ≠ infinite reduction — report as ≥ log₁₀(N₀ / detection limit)
- •A negative log reduction means the population grew — check controls
- •Always report contact time, temperature, organism, and soil load alongside the LR value
- •Sanitizer / disinfectant / sterilant are regulated terms with specific thresholds — use them correctly on labels
Pro Tips
- →Plate at multiple 10-fold dilutions to bracket the expected surviving count
- →Use a validated neutralizer (Dey-Engley, lecithin/Tween) to stop kill at the exact contact time
- →Verify the starting inoculum titer by plate count — assumed titers introduce log-level error
- →Total log reduction = exposure time / D-value (decimal reduction time)
FAQs
What does a 3-log reduction mean?
A 3-log reduction means the microbial population was reduced by a factor of 1,000 — equivalent to killing 99.9 % of organisms and leaving 0.1 % surviving. In regulatory terms, 3-log is the minimum efficacy required for an EPA / NSF P152 food-contact sanitizer. So if you start with 1,000,000 CFU/mL and end with 1,000 CFU/mL, that is a 3-log reduction.
What's the difference between log reduction and percent reduction?
They describe the same kill on different scales. Percent reduction is the linear fraction killed: 1 − N/N₀. Log reduction is log₁₀(N₀/N). Each whole log = a 10-fold drop. The mapping is: 1-log = 90 %, 2-log = 99 %, 3-log = 99.9 %, 4-log = 99.99 %, 5-log = 99.999 %, 6-log = 99.9999 %. Logs are preferred for disinfection because they distinguish kills that look identical on the percent scale (e.g., 99.9 % vs 99.9999 %).
How do I report log reduction when the final count is zero?
A 'no recovery' result doesn't mean infinite reduction — it means kill exceeded your detection limit. The correct way to report it is ≥ log₁₀(N₀ / detection limit). For example, if you started with 10⁶ CFU and your assay detects down to 1 CFU, report '≥ 6-log reduction'. This calculator caps the displayed value at 12-log when N = 0 to signal complete kill.
What is the difference between a sanitizer, a disinfectant, and a sterilant?
These regulated terms correspond to specific log-reduction thresholds. A sanitizer must achieve ≥ 3-log (99.9 %) reduction of bacteria — used on food-contact surfaces (NSF P152, EPA DIS/TSS-10). A disinfectant achieves ≥ 4-log to 6-log against a broader spectrum (EN 1276, EN 13697). A sterilant or sterilization process must achieve ≥ 6-log against bacterial spores (USP <1072>; ISO 11137 for gamma irradiation; ISO 17665 for steam).
Why use logs instead of percentages?
Because microbial populations span huge ranges. The difference between a 99.99 % kill and a 99.9999 % kill is only 0.0099 % linearly — but it is a 100-fold difference in surviving organisms (10² vs 10⁰), which can mean the difference between an outbreak and a safe product. The log scale makes this visible and comparable, and matches the first-order kinetics that most disinfection processes actually follow.
Can log reduction be negative?
Yes — a negative log reduction means the population grew during the test rather than being killed. This can happen with ineffective biocides, insufficient contact time, neutralizer failure, contaminated test surfaces, or growth-supporting matrices. A −1-log result means the population grew 10-fold. Always treat negative LR as a process-failure signal and re-run controls before re-testing.
How is log reduction related to D-value?
The D-value (decimal reduction time) is the time required to achieve a 1-log (90 %) reduction under fixed conditions. Total log reduction in a process = exposure time / D-value. For example, milk pasteurization uses a 12-D process against Mycobacterium bovis: 12 × D-value of exposure achieves 12-log inactivation. Heat sterilization design (F₀ values) is built directly on this relationship.
How do I calculate log reduction from two CFU counts?
Divide the initial count (N₀) by the surviving count (N), then take the base-10 logarithm: LR = log₁₀(N₀ / N). For example, with N₀ = 2,000,000 CFU/mL and N = 200 CFU/mL, the ratio is 10,000, and log₁₀(10,000) = 4, so that is a 4-log (99.99 %) reduction. The two counts must use the same units for the ratio to be valid.
What is a 5-log reduction and where is it required?
A 5-log reduction is a 100,000-fold drop in microbial population — equivalent to killing 99.999 % of organisms. It is the FDA Juice HACCP requirement (21 CFR 120.24) for pathogen reduction in fresh-squeezed juices and is also a common benchmark for produce-wash validation and some high-level disinfection claims. Starting at 10⁶ CFU/mL, a 5-log process leaves just 10 CFU/mL surviving.
Does log reduction depend on the units I use?
No — log reduction is a ratio, so the units cancel out. Whether you measure in CFU, CFU/mL, CFU/cm², or PFU, the log reduction is identical as long as N₀ and N are expressed in the same units. This is why the metric travels well between suspension tests, surface tests, and water-treatment data. Just never mix units between your two counts.
Why does my disinfectant show a lower log reduction on dirty surfaces?
Organic soil — blood, food residue, biofilm, body fluids — physically shields microorganisms and chemically consumes the active biocide before it reaches the cells. 'Dirty condition' tests routinely show 1–3 logs less kill than 'clean condition' tests of the same product. This is why standards like EN 1276 specify the exact interfering substance and concentration, and why real-world cleaning before disinfection is essential.