Last updated: May 24, 2026
Allele Frequency Calculator

Creators
Dharmendra SinghReviewers
Creators
Dharmendra SinghReviewers
Quick Answer
The Allele Frequency Calculator uses the Hardy-Weinberg equilibrium (p + q = 1; p² + 2pq + q² = 1) to compute allele and genotype frequencies from population data. Enter the number of homozygous-recessive individuals and the total population to get q (recessive allele frequency), p (dominant allele frequency), carrier frequency (2pq), and homozygous-dominant frequency (p²).
To find allele frequencies, divide the number of recessive individuals by the total population to get q squared, take the square root to get q, then subtract from one to get p.
Key Takeaways
- Hardy-Weinberg links allele and genotype frequencies: p + q = 1 and p² + 2pq + q² = 1
- Start from the recessive phenotype: q² = affected ÷ total, then q = √(q²), and p = 1 − q
- p² = homozygous dominant (AA), 2pq = heterozygous carriers (Aa), q² = homozygous recessive (aa)
- Carriers (2pq) are always far more common than affected individuals (q²)
- The model assumes no mutation, selection, drift, migration, or non-random mating — deviations signal evolution
Creators
Dharmendra SinghReviewers
Creators
Dharmendra SinghReviewers
Formula
q² = disease frequency → q = √q² → p = 1 − q (Hardy-Weinberg: p² + 2pq + q² = 1)
Where:
- p=Healthy allele frequency (dominant)
- q=Mutant allele frequency (recessive)
- p²=Homozygous dominant genotype frequency
- 2pq=Heterozygous (carrier) genotype frequency
- q²=Homozygous recessive / disease frequency
Worked Examples
Cystic Fibrosis — "1 in 2,500" Europeans
About 1 in 2,500 Europeans is born with cystic fibrosis. Use the 1-in-N input.
- 1q² = 1 / 2,500 = 0.0004
- 2q = √0.0004 = 0.02 → mutant allele frequency
- 3p = 1 − 0.02 = 0.98 → healthy allele frequency
- 42pq = 2 × 0.98 × 0.02 = 0.0392 → ~3.92% carriers (~1 in 25)
Sickle Cell — 4% Frequency
In a West-African population the disease frequency is about 4%. Use the percentage input.
- 1q² = 4% = 0.04
- 2q = √0.04 = 0.2 → mutant allele frequency
- 3p = 1 − 0.2 = 0.8 → healthy allele frequency
- 42pq = 2 × 0.8 × 0.2 = 0.32 → 32% carriers
Albinism — Population Counts
5 affected individuals in a sample of 20,000. Use the From-population-counts mode.
- 1q² = 5 / 20,000 = 0.00025
- 2q = √0.00025 ≈ 0.0158
- 3p = 1 − 0.0158 ≈ 0.9842
- 42pq ≈ 0.0311 → ~3.11% carriers (~1 in 32)
Introduction
The Allele Frequency Calculator computes genotype and allele frequencies in a population using the Hardy-Weinberg equilibrium principle. Understanding allele distribution is fundamental to population genetics — related tools include our Punnett square calculator for predicting offspring genotypes and the dihybrid cross calculator for two-gene inheritance patterns.
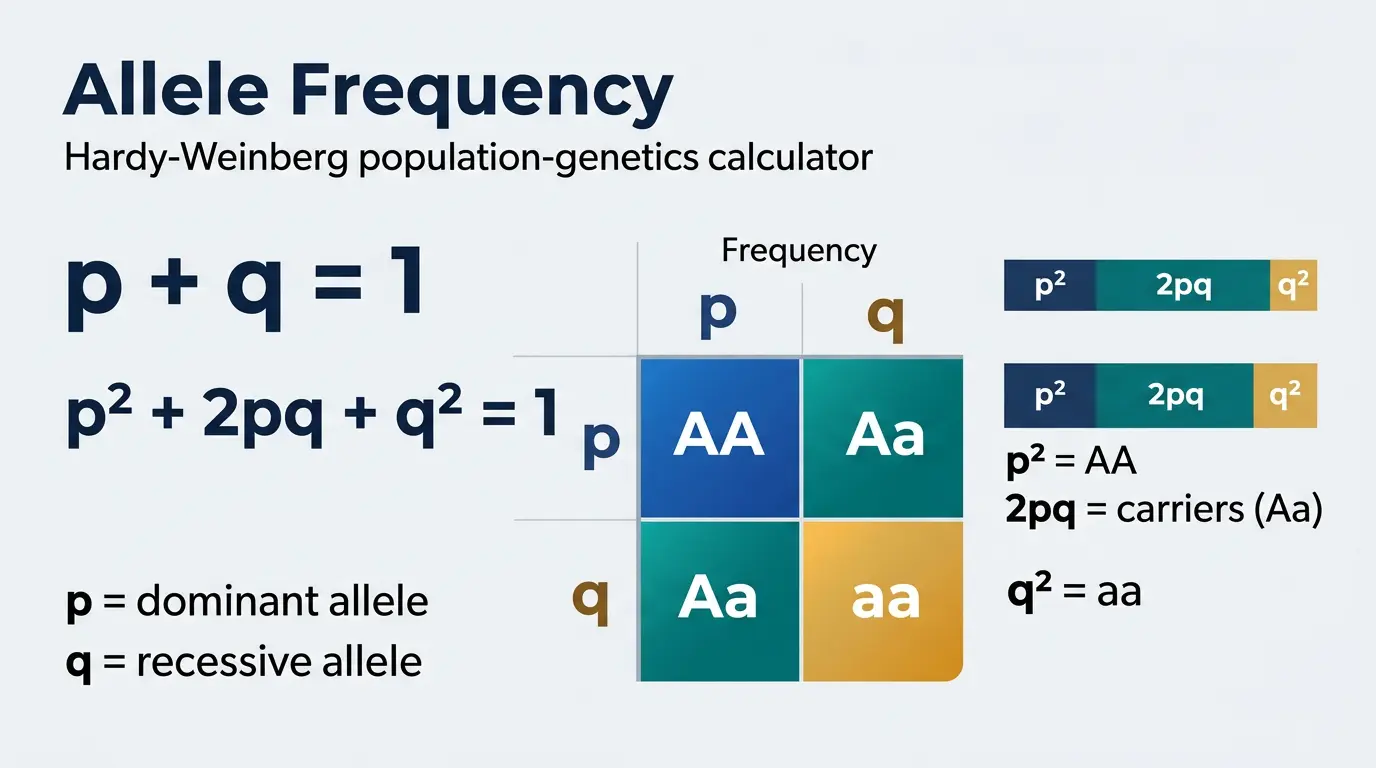
What is Hardy-Weinberg Equilibrium?
The Hardy-Weinberg principle states that allele and genotype frequencies in a population remain constant from generation to generation in the absence of evolutionary forces. It was independently formulated by G.H. Hardy and Wilhelm Weinberg in 1908.
p = frequency of dominant allele (A)
q = frequency of recessive allele (a)
p + q = 1 (all alleles sum to 100%)
p² = frequency of homozygous dominant (AA)
2pq = frequency of heterozygotes/carriers (Aa)
q² = frequency of homozygous recessive (aa)
Hardy-Weinberg Assumptions
The equilibrium holds only when certain conditions are met. Violations indicate evolution is occurring in the population.
- No mutation:
Alleles are not changing from one form to another
- No natural selection:
All genotypes have equal fitness
- Random mating:
No preference for genotype in mate choice
- No genetic drift:
Population is infinitely large
- No gene flow:
No migration into or out of the population
Real populations never perfectly meet all assumptions. Hardy-Weinberg remains useful as an approximation and baseline to detect evolutionary forces.
How to Calculate Allele Frequencies
The most common approach uses the frequency of the homozygous recessive phenotype as the starting point, since it is the only genotype directly observable from phenotype.
- 1
Count individuals showing the recessive phenotype in your sample
- 2
Divide by total population to get q² (homozygous recessive frequency)
- 3
Take the square root of q² to find q (recessive allele frequency)
- 4
Calculate p = 1 − q (dominant allele frequency)
- 5
Calculate genotype frequencies: p² (AA), 2pq (Aa), q² (aa)
This method only works for traits with complete dominance where the recessive phenotype is clearly distinguishable. For codominant traits (like blood types), you can count genotypes directly without needing the square root step.
Applications in Genetics and Medicine
Hardy-Weinberg calculations have practical applications across multiple fields of biology and medicine.
- Genetic counseling:
Estimating carrier probability for autosomal recessive disorders
- Forensic genetics:
Calculating DNA profile match probability in a population
- Pharmacogenomics:
Predicting frequency of drug-metabolizing enzyme variants
- Conservation biology:
Assessing genetic diversity in endangered species
- Epidemiology:
Estimating disease prevalence and carrier rates for screening programs
For newborn screening programs, Hardy-Weinberg calculations help determine the cost-effectiveness of testing. If the carrier frequency (2pq) is above 1 in 30, universal screening is typically recommended over targeted screening.
Common Genetic Disorders and Their Frequencies
Many well-studied genetic disorders follow autosomal recessive inheritance, making them ideal for Hardy-Weinberg analysis.
- Cystic fibrosis:
q² ≈ 1/2,500 in Europeans, carrier rate ≈ 1/25
- Sickle cell disease:
q² ≈ 1/625 in West Africans, carrier rate ≈ 1/12
- Phenylketonuria (PKU):
q² ≈ 1/10,000, carrier rate ≈ 1/50
- Tay-Sachs disease:
q² ≈ 1/3,600 in Ashkenazi Jews, carrier rate ≈ 1/30
- Albinism:
q² ≈ 1/20,000, carrier rate ≈ 1/70
| Disorder | Population | q² (affected) | q (allele freq.) | Carrier rate (2pq) |
|---|---|---|---|---|
| Cystic fibrosis | Europeans | ~1/2,500 | ~0.02 | ~1/25 |
| Sickle cell disease | West Africans | ~1/625 | ~0.04 | ~1/12 |
| Tay-Sachs disease | Ashkenazi Jews | ~1/3,600 | ~0.017 | ~1/30 |
| Phenylketonuria (PKU) | General | ~1/10,000 | ~0.01 | ~1/50 |
| Albinism (OCA) | General | ~1/20,000 | ~0.007 | ~1/70 |
Carriers (2pq) always greatly outnumber affected individuals (q²) — this is why recessive alleles persist in populations even when the disease is rare.
Limitations and When Not to Use
While powerful, Hardy-Weinberg calculations have important limitations.
- X-linked traits:
Males are hemizygous, standard HW equations don't apply
- Multiple alleles:
ABO blood type has 3 alleles, requiring modified equations
- Small populations:
Genetic drift causes significant deviations
- Assortative mating:
Preferential mating by genotype violates assumptions
- Population stratification:
Mixed populations with different allele frequencies
Common Mistakes to Avoid
Hardy-Weinberg problems trip up students and researchers in predictable ways. Avoid these errors for correct allele and genotype frequencies.
- Forgetting the square root:
q = √(q²), not q². The recessive allele frequency is the square root of the homozygous-recessive frequency
- Confusing carriers with affected:
2pq (heterozygous carriers) is not the same as q² (affected homozygotes) — carriers are far more common
Counting the dominant phenotype as one genotype: dominant phenotype = AA + Aa (p² + 2pq); you cannot get p directly from it
Applying autosomal equations to X-linked traits: in males, allele frequency equals phenotype frequency (no square root)
- Using tiny samples for rare alleles:
when q < 0.01, small samples give wildly unstable estimates
Quick check: p² + 2pq + q² must equal 1, and p + q must equal 1. If they don't, re-examine your counts.
Population Genetics Glossary
Key terms used in Hardy-Weinberg and allele-frequency analysis:
| Term | Definition |
|---|---|
| Allele | An alternative form of a gene at a given locus (e.g. dominant A or recessive a). |
| Allele frequency (p, q) | The proportion of a specific allele among all alleles at that locus in the population. |
| Genotype frequency | The proportion of individuals with a specific genotype (AA, Aa, or aa). |
| Homozygous | Carrying two identical alleles (AA or aa). |
| Heterozygous (carrier) | Carrying two different alleles (Aa); shows the dominant phenotype but carries the recessive allele. |
| Hardy-Weinberg equilibrium | The state where allele and genotype frequencies stay constant across generations without evolutionary forces. |
| Genetic drift | Random change in allele frequencies, strongest in small populations. |
| Gene flow | Movement of alleles between populations through migration. |
Quick Reference Card
Allele Frequency Calculator — Quick Reference
Quick reference • Allele Frequency Calculator
q² = affected/total → q = √(q²) → p = 1 − q → 2pq, p²Valid range: 0 ≤ recessive count ≤ total population; total > 0
Common Values
⚠ Watch Out
- •Take the square root: q = √(q²), not q²
- •Carriers (2pq) are not affected individuals (q²)
- •Standard equations are for autosomal traits, not X-linked
- •Rare alleles (q < 0.01) need large samples for accuracy
Pro Tips
- →Only the recessive phenotype reveals its genotype directly — start there
- →Check your work: p + q = 1 and p² + 2pq + q² = 1
- →For codominant traits (e.g. blood type) count genotypes directly — no square root needed
FAQs
What is the Hardy-Weinberg equation?
It consists of two parts: p + q = 1 (allele frequencies sum to 1) and p² + 2pq + q² = 1 (genotype frequencies predicted from allele frequencies). p is the dominant allele frequency, q is the recessive allele frequency.
How do I find q² from population data?
q² equals the number of individuals showing the recessive phenotype divided by total population. Example: 9 out of 900 have a recessive disorder, so q² = 9/900 = 0.01.
What does 2pq represent?
2pq is the frequency of heterozygous individuals (carriers). They carry one copy of the recessive allele but appear phenotypically normal. Carriers can pass the recessive allele to offspring.
Can I use this for X-linked traits?
The standard equation applies to autosomal traits. For X-linked traits, males express the allele directly (frequency = q), while females follow the standard p² + 2pq + q² = 1.
Why is carrier frequency so high compared to disease frequency?
Carriers (2pq) are always much more common than affected individuals (q²) because carriers need only one copy of the recessive allele. For cystic fibrosis, ~1 in 25 are carriers while only ~1 in 2,500 are affected.
How large should my population sample be?
For reliable estimates, sample at least 50-100 individuals. For rare alleles (q < 0.01), much larger samples (thousands) are needed for accuracy.
How do I calculate the dominant allele frequency (p)?
Find q first from the recessive phenotype (q = √(q²)), then use p = 1 − q. You cannot get p directly from the dominant phenotype, because the dominant phenotype includes both homozygous dominant (p²) and heterozygous (2pq) individuals.
What is the difference between allele frequency and genotype frequency?
Allele frequency (p, q) is the proportion of each allele among all alleles at a locus. Genotype frequency (p², 2pq, q²) is the proportion of individuals with each genotype. The Hardy-Weinberg equation links them: p² + 2pq + q² = 1.
How do I know if a population is in Hardy-Weinberg equilibrium?
Compare observed genotype counts to those predicted by p² + 2pq + q² using a chi-square goodness-of-fit test. A significant difference suggests an evolutionary force (selection, drift, non-random mating, migration, or mutation) is acting on the population.
Why use the recessive phenotype to start the calculation?
With complete dominance, only the homozygous recessive genotype (aa) is directly identifiable from phenotype — every aa individual shows the recessive trait. Dominant-phenotype individuals could be AA or Aa, so you cannot count genotypes directly from them; you work back from q² instead.